Time Log Teams – time spent on other Teams’ sites (must have 3 entries or more):
Date: Mar. 02, 2026 From: 13:00pm To: 13:10pm (10 minutes)
Date: Mar. 03, 2026 From: 09:55am To: 10:05am (10 minutes)
Date: Mar. 04, 2026 From: 12:55pm To: 13:05pm (10 minutes)
Time Log Students – time spent on other students’ sites (must have 3 entries or more):
Date: Mar. 02, 2026 From: 12:50pm To: 13:00pm (10 minutes)
Date: Mar. 03, 2026 From: 09:45am To: 09:44am (10 minutes)
Date: Mar. 04, 2026 From: 12:45pm To: 12:55pm (10 minutes)
Essay I. Summary of your activities in your contents including new contents created (one paragraph). Provide all the hyperlinks (clickable) of new contents you have created this week.
This week I continued expanding my Travel Journal and aligning it with the homework structure in my menu. I created two new posts, Charleston and Denver, each with free‑to‑use images. I added both under the Travel Journal section in my main navigation for general visitors and again under HWs → HW9 for grading. I also checked categories and tags so all city posts share the Travel category and city‑specific tags, while homework posts remain grouped under their IS 5320 Homework categories. Throughout the week I kept visiting classmates’ and teams’ sites, leaving comments, moderating comments on my own site, and using GA4 to monitor how my newer travel posts are starting to appear in the traffic mix.
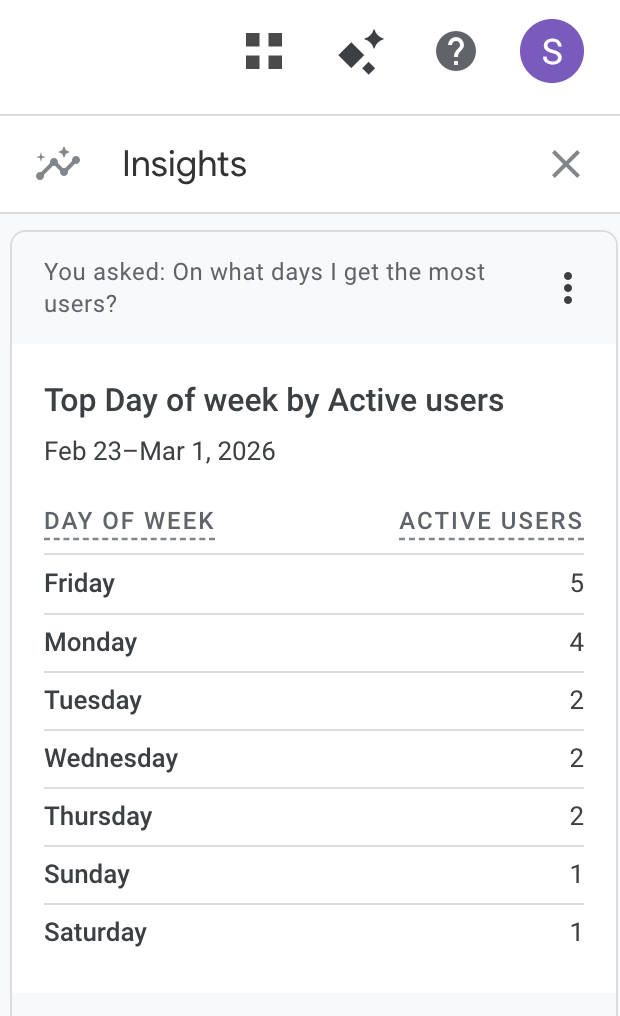
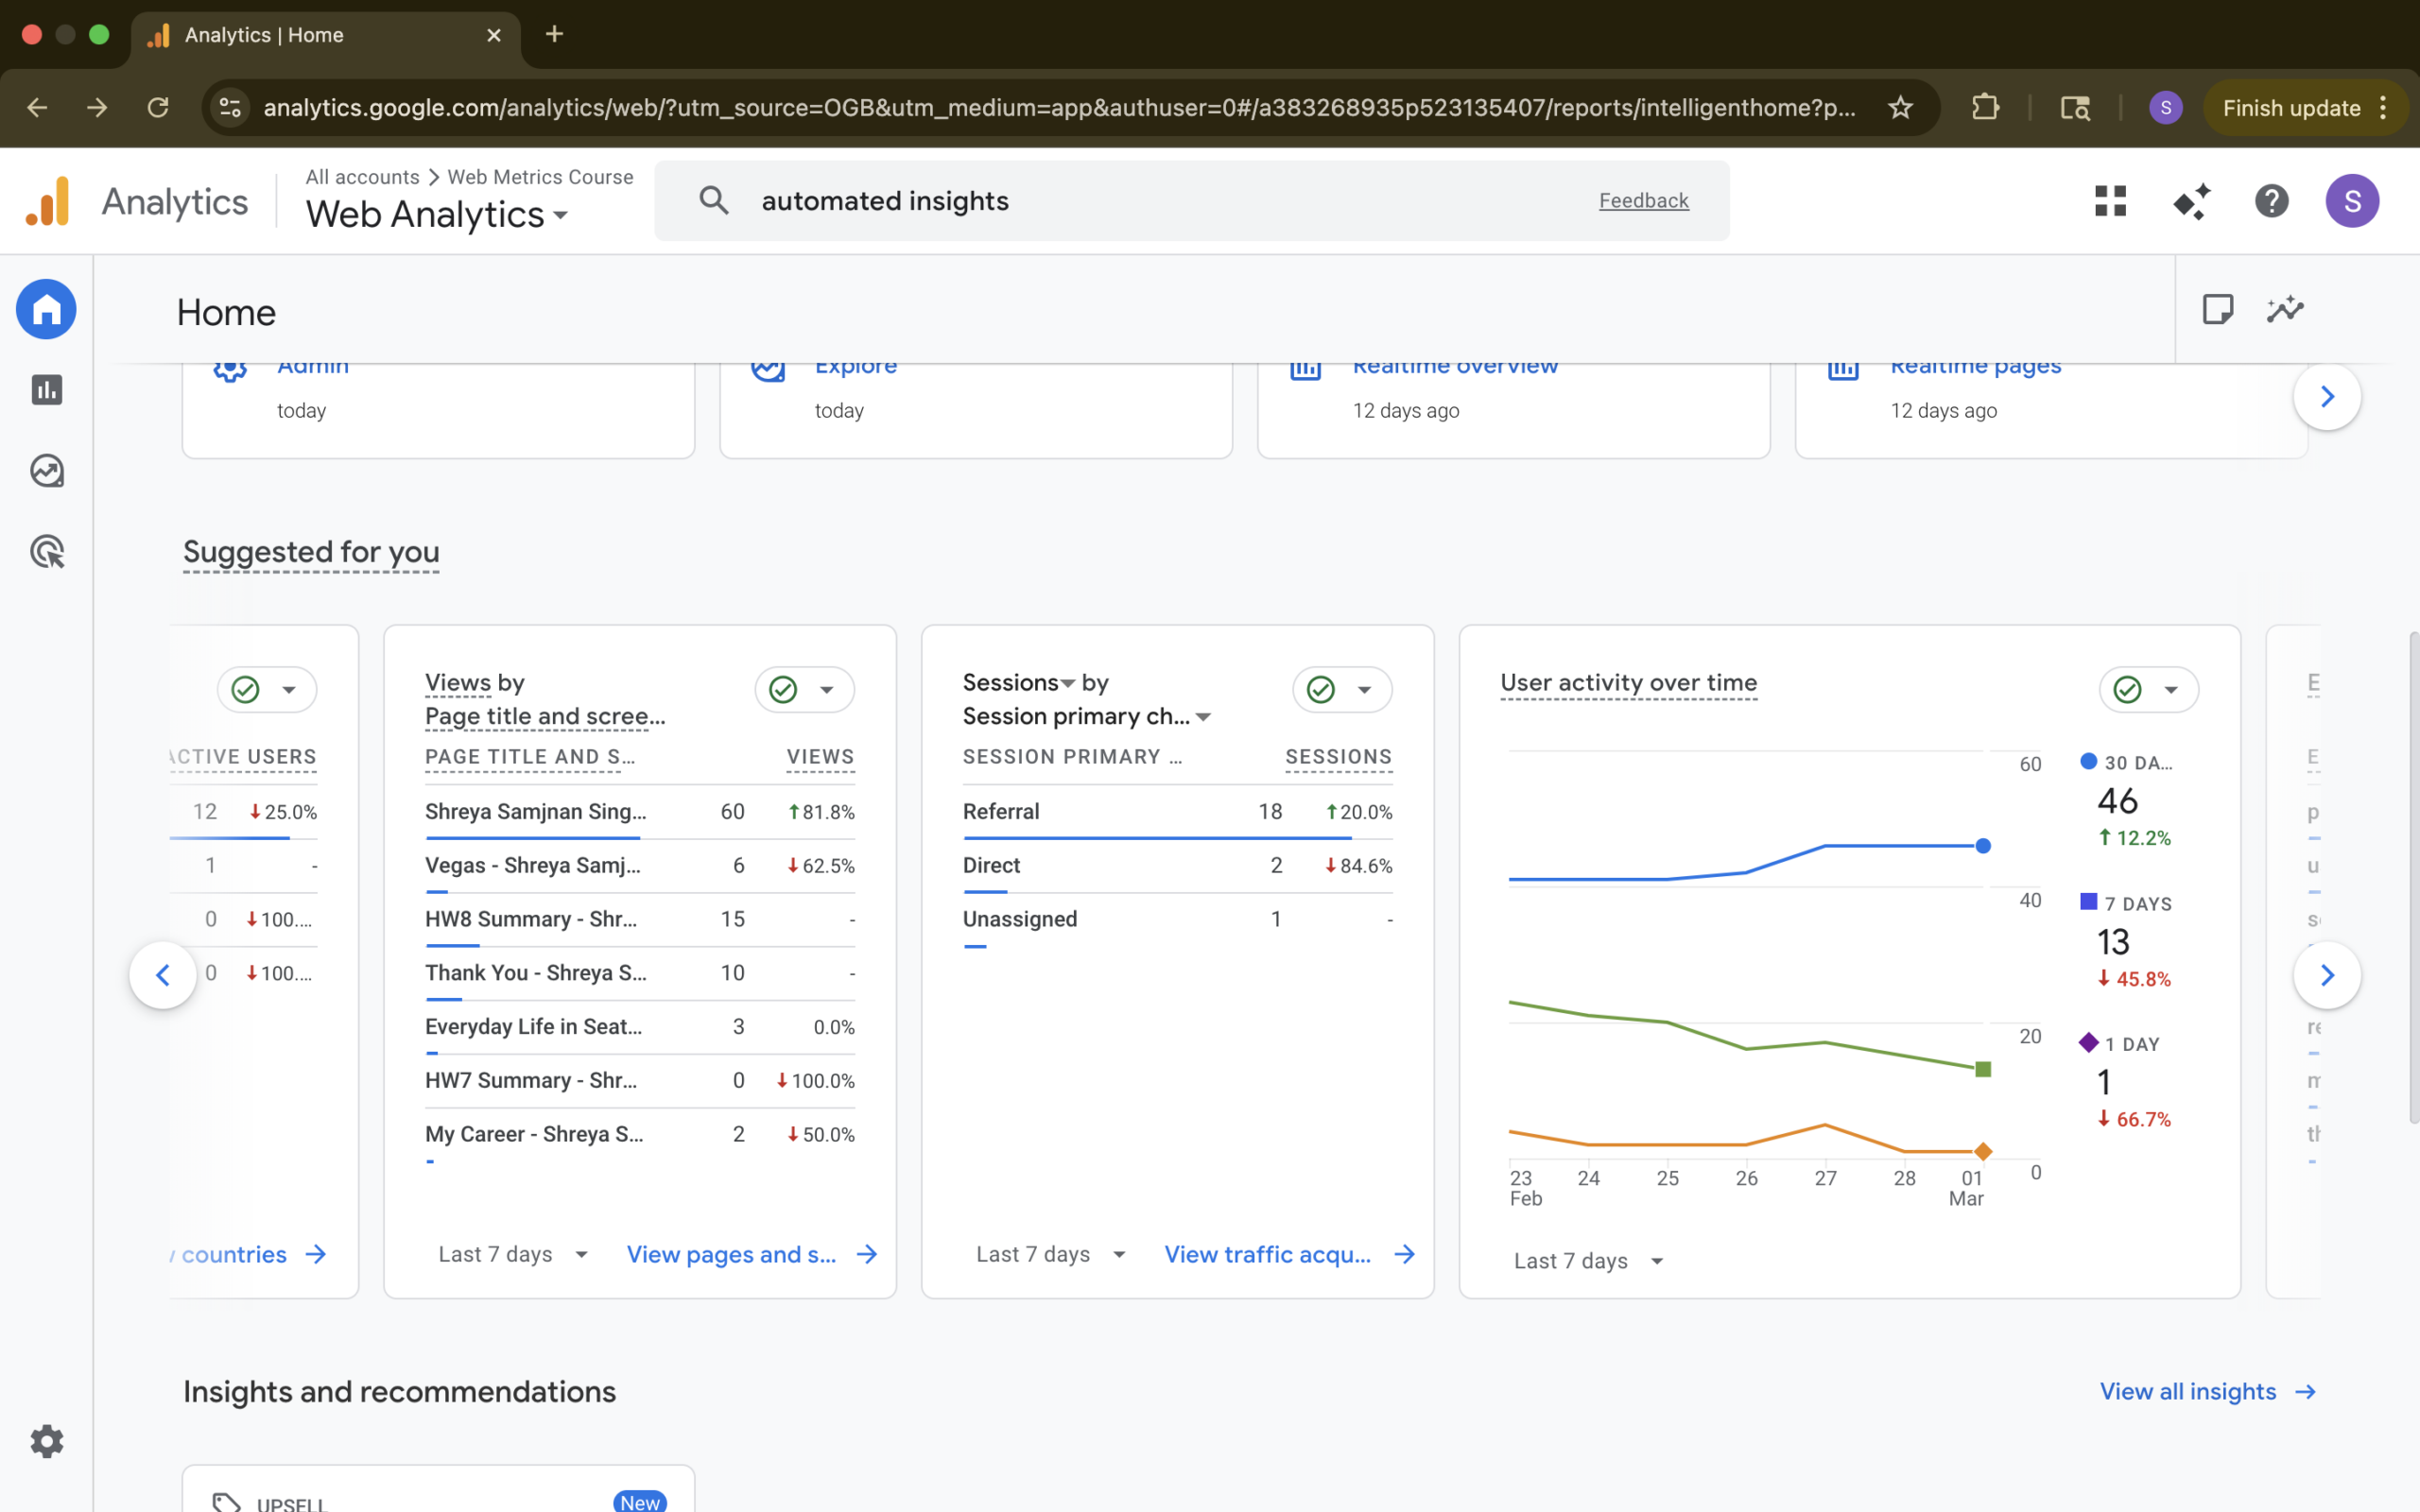
Essay II. Summary/analysis of your ‘automated insights’ (add screenshots) (one paragraph)
In GA4, I used the Automated Insights features to better understand when people are most active on my site and which pages they view the mostFrom the Home screen and the Insights panel, I asked questions like On what days I get the most users? and What are my top pages and screens by views? The resulting insight cards showed that, for the period from February 23 to March 1, Fridays and Mondays had the highest numbers of active users, while days like Sunday and Saturday had only one active user each. Another insight card highlighted my top pages by views, where my home page, the HW8 Summary post, the Thank You page, and my Vegas travel post were among the most‑visited pages in that same date range. Even though my traffic is small and driven mostly by classmates, these automated insights helped me see which days people tend to check the site and which types of content get the most attention without needing to manually build a custom report.
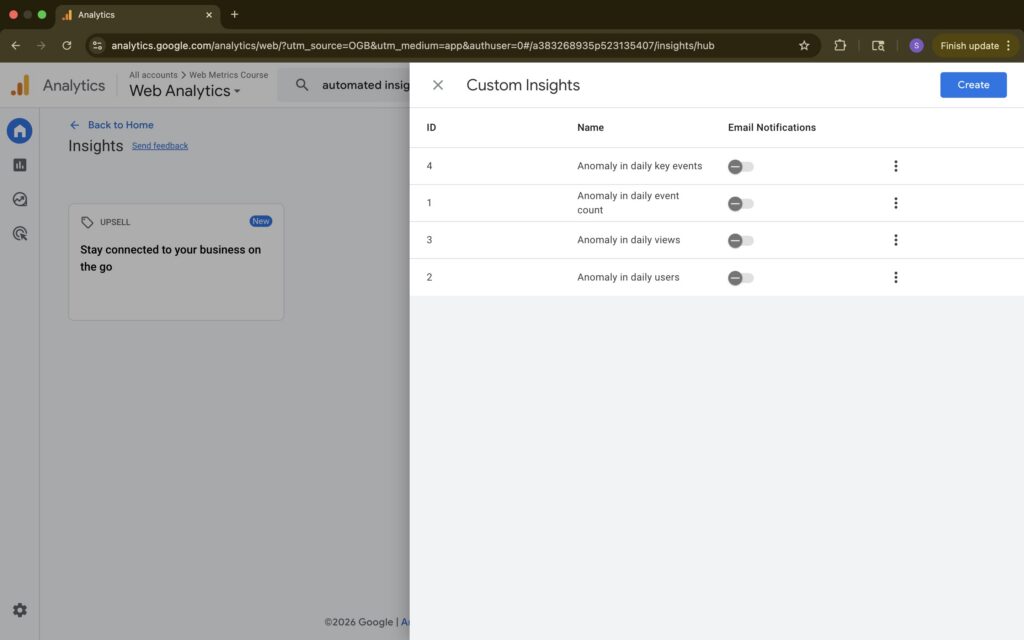
Essay III. Summary/analysis of your ‘custom insights’ (add screenshots) (one paragraph)
For Custom Insights in GA4, I decided to rely on the suggested insights that Google provides instead of building my own rules from scratch. In the Custom Insights section, I reviewed the recommended cards such as Anomaly in daily users, Anomaly in daily views, Anomaly in daily event count, and Anomaly in daily key events, and enabled them so GA4 would automatically watch for unusual patterns. These suggestions use GA4’s anomaly‑detection models to compare my current data against historical behavior, which is helpful for a small class site where I don’t have enough traffic to define very specific thresholds. By turning on these recommended custom insights, I get alerts when something looks off or unexpectedly high in users, views, or key events across my site without needing to fine‑tune conditions for each page. This setup lets me focus on reading and interpreting the insight cards rather than managing complex configurations, while still giving me a sense of when my metrics move in ways that are worth a closer look.