Time Log Teams – time spent on other Teams’ sites (must have 3 entries or more):
Date: Mar. 09, 2026 From: 12:00pm To: 12:10pm (10 minutes)
Date: Mar. 10, 2026 From: 06:20pm To: 06:30pm (10 minutes)
Date: Mar. 11, 2026 From: 04:05pm To: 04:15pm (10 minutes)
Time Log Students – time spent on other students’ sites (must have 3 entries or more):
Date: Mar. 09, 2026 From: 12:10pm To: 12:20pm (10 minutes)
Date: Mar. 10, 2026 From: 06:30pm To: 06:40pm (10 minutes)
Date: Mar. 11, 2026 From: 04:15pm To: 04:25pm (10 minutes)
Essay I. Summary of your activities in your contents including new contents created (one paragraph). Provide all the hyperlinks (clickable) of new contents you have created this week.
This week I continued expanding my Travel Journal and organized my content so it works for both general visitors and the HW10 grading structure. I created two new posts, San Diego and Miami, each with free‑to‑use Unsplash image and added them as submenu items under my Travel Journal section as well as under HWs → HW10. I kept categories and tags consistent by assigning the Travel category and city‑specific tags to all travel posts, and using IS 5320 Homework 10 for this week’s homework posts. I also monitored traffic in GA4, visited teammates’ and classmates’ sites to leave comments, moderated comments on my own posts, and started thinking about how my new KPI table and Looker Studio report can highlight the most important behaviors on my site, like visitors reaching the Thank You page or exploring multiple travel posts in a session.
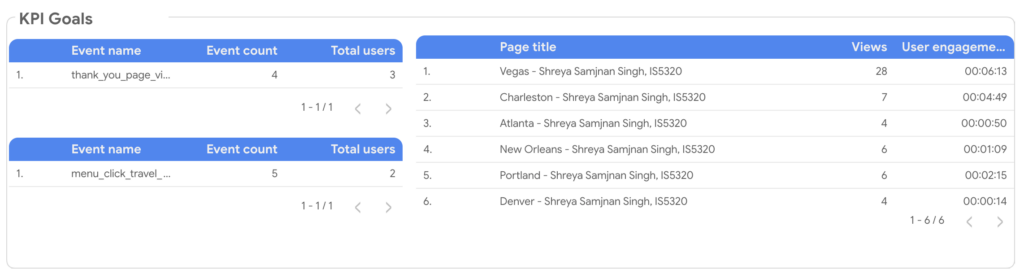
Essay II. Summary of your KPI table (add screenshots or table) (one paragraph excluding the KIP table)
For HW10 I defined a small set of KPIs that match how I actually want people to use my site, then mapped them to concrete GA4 metrics I can visualize in Looker Studio. My first goal is to encourage visitors to reach my Thank You page after interacting with content, so I use the custom event thank_you_page_view as the main KPI and track its event count and total users in my report. My second goal is to grow engagement with my Travel Journal posts, so I look at views and user engagement time for those pages, which currently show Vegas, Charleston, Atlanta, New Orleans, Portland, and Denver as the top travel destinations in my table. My third goal is to encourage navigation via the main menu, so I rely on the custom event menu_click_travel_journal and its event count to understand how often visitors are using the Travel Journal menu item to explore my site.
| Goal | KPIs | Metrics |
| Goal 1: Encourage visitors to reach my Thank You page after interacting with the site. | Number of visitors who reach Thank You page | Event name = thank_you_page, Event count, Users |
| Goal 2: Increase engagement with Travel Journal posts. | Travel Journal page views | Views by Page title, Average engagement time |
| Goal 3: Encourage visitors to use main menu. | Number of menu_click events on main navigation items | Event name = menu_click, Event count, Users |
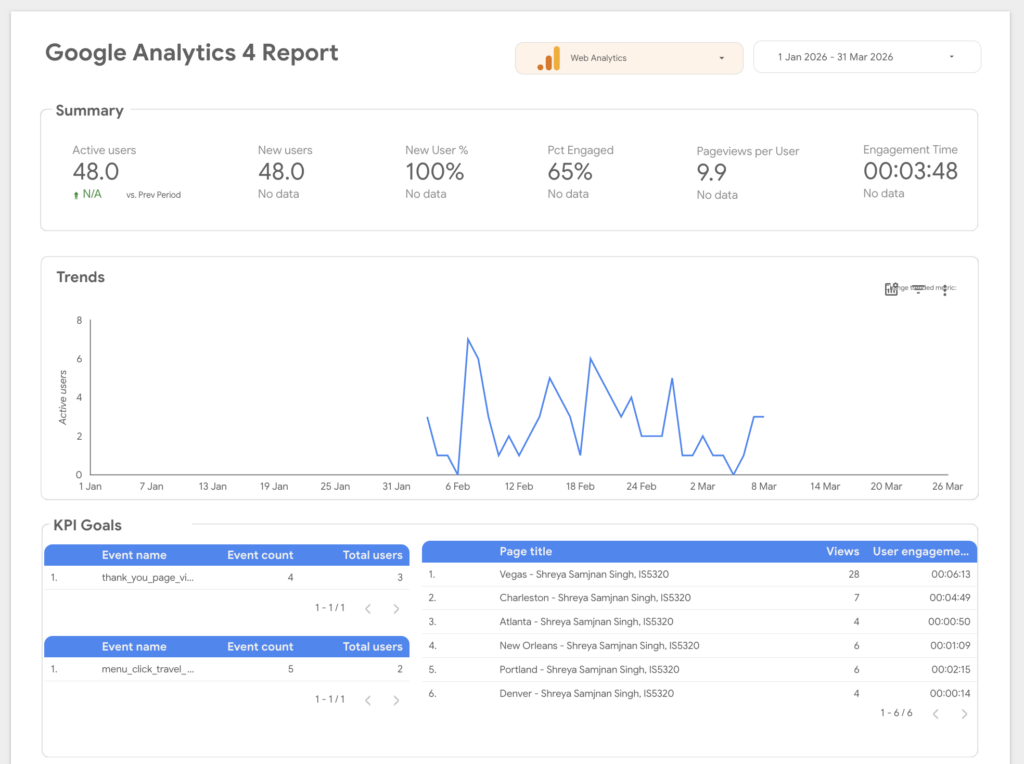
Essay III. Summary of your Looker Studio Report with your KPI identified (add screenshots) (one paragraph)
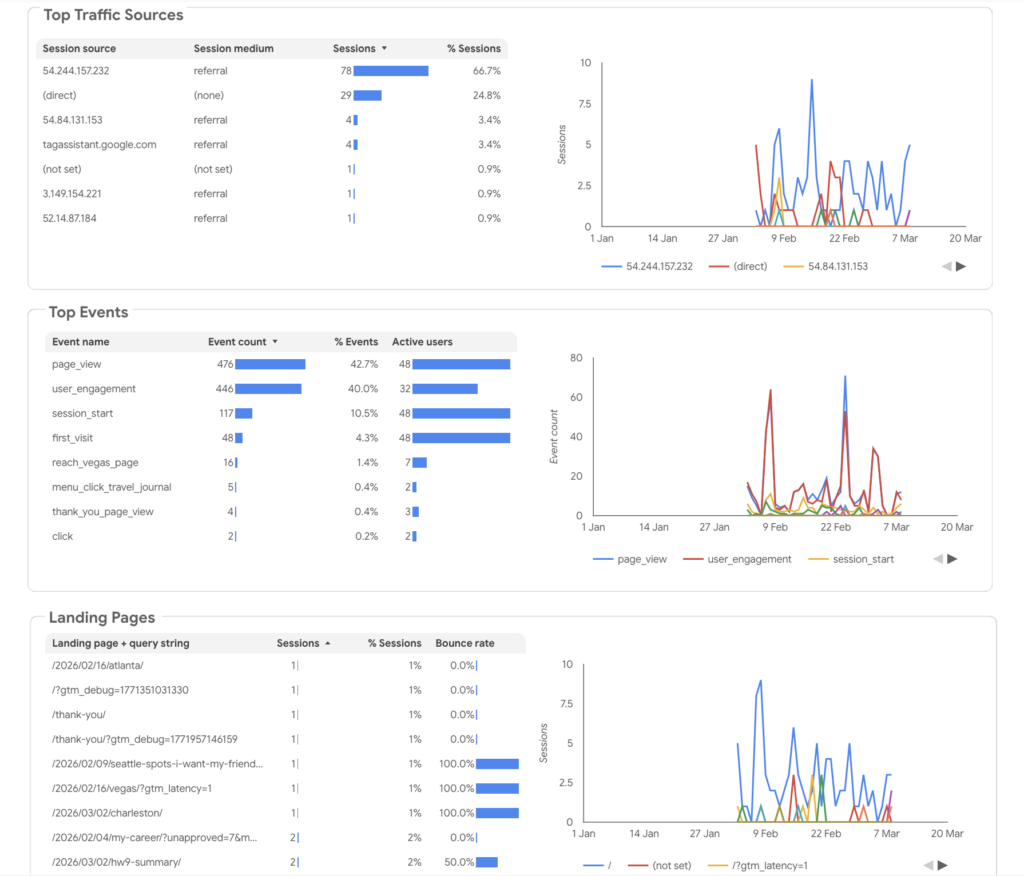
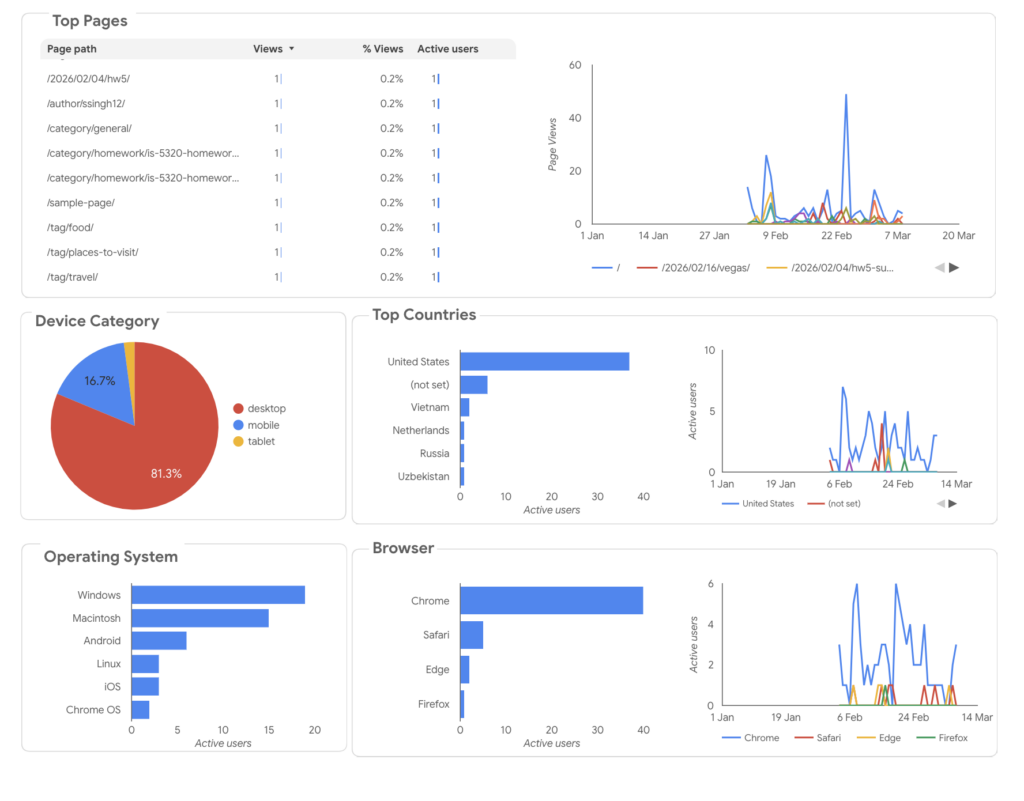
In Looker Studio, I built a GA4 dashboard that brings all of these KPIs together so I can see overall traffic and my key goals on a single page. The top of the report shows summary metrics like Active users, Pageviews per User, Engagement time, and the percentage of engaged sessions for the period from January 1 to March 31, along with a trend line for new users. Below that, a dedicated events table highlights my conversion‑style events so I can quickly see how often the Thank You page is viewed and how frequently visitors click the Travel Journal menu item. Another section lists page titles with views and user engagement time, where my travel posts stand out, and additional tables show landing pages, page paths, and top traffic sources by referral and direct sessions. This layout turns my KPI table into a practical dashboard that helps me understand not just how much traffic I get, but which posts and navigation elements are actually driving engagement with my Travel Journal and Thank You page.